Product Dossier  ·  v30.5.37

Verified math.
Not asserted.

Every build of the VRP Quant terminal runs a deterministic proof suite in continuous integration before it can deploy. The report it produces is published on this site, stamped with the engine fingerprint and commit you can read in the terminal sidebar. If the mathematics breaks, the build goes red and it does not ship.

Verification
Pass
Checks
339 / 339
Version
v30.5.37
Report
published
Product Description

A variance risk premium research terminal that shows its working.

Three modules. The Scanner ranks a universe on volatility-regime and premium-richness criteria. Deep Dive takes one name and prices a position three ways from the same inputs, then shows you how far the three disagree. The Scan Journal logs every name the Scanner scores and, once each horizon has passed, measures the model against what followed.

What it does not do is hand you a trade and hide the derivation. Every strike is traceable to a stated basis, every volatility figure to a stated estimator, every price to a stated model, and every data point to the source that actually served it.

Architecture

Every ticker runs the same pipeline. No shortcuts, no exceptions.

Six-source data waterfall

Alpha Vantage, Google Finance, Polygon, yfinance, FRED and NewsAPI, each with per-request health reporting. Source indicators reflect the outcome of the actual request, never merely that a key is configured. A throttled reply that arrives dressed as a success is caught and marked as a fallthrough. Every price carries the time it was valid and is labelled live, delayed, last close, stale or unknown against the market session — "live" only when the timestamp supports it — and every price history states its units and whether it is split- or dividend-adjusted.

Gap-aware volatility

Yang-Zhang realised volatility over a fixed window, so overnight gaps are measured instead of ignored. Close-to-close estimators treat a gap as though it never happened, which is exactly backwards for anyone short premium.

Three pricing methods, one set of inputs

Black-Scholes closed form, an 800-step Cox-Ross-Rubinstein lattice covering European and American exercise, and Monte Carlo across five to fifty thousand paths with optional Merton jump diffusion. The lattice reports its own error against the closed-form price on screen. All three share the same volatility, rate and strike, so their agreement checks the arithmetic, not the inputs — and with jumps switched on the simulation is a different model by design, so its numbers are not expected to match the closed form.

Implied volatility, solved not borrowed

At-the-money implied volatility is solved from the live chain's own bid and ask — the call side and the put side independently, at the expiry's actual days to expiry and the current Treasury rate — rather than read out of a data vendor's implied-volatility field. The two sides are compared at the same strike and expiry; listed options are American and many underlyings pay dividends, so some gap is normal, but a gap too large for early exercise and dividends to explain marks a stale or one-sided quote and the chain is rejected. A last trade is used only if it is recent, and then with its real uncertainty, never as a price known to the cent. Where the quoted market is too wide to identify a volatility at all, it says so rather than reporting a number. Every Greek, every tree price and every simulation below it inherits that figure — and that contract's expiry, and one stated dividend assumption — which is why their provenance is printed beside them.

Strike selection you control

Delta-selected strikes solve numerically for the strike carrying that delta. Sigma bands are drift-corrected lognormal quantiles. They are related and not equal, and the terminal keeps them as separate choices rather than quietly conflating them.

Live discount rate

Discounting uses the current three-month Treasury yield pulled from FRED and dated on screen, not a hardcoded constant left over from whenever the file was written. If FRED is unreachable, the 13-week T-bill index stands in and the screen says so.

Build traceability

The terminal's sidebar shows its version, the engine file's SHA-256 fingerprint and the commit it was deployed from; the verification report prints the same fingerprint and the exact package versions it ran against. Where they match, the software in front of you is the software that was proven. The terminal deploys only from a branch that advances after the verification suite and a smoke test of every screen pass.

Scan Journal: the model, measured

Every scanned name is logged with its readings and one standard reference position, a short 16-delta put priced at the logged implied volatility with the name's dividend yield. When its horizon passes, the journal records whether implied volatility exceeded the volatility that followed — measured with the same Yang-Zhang estimator as the entry reading — and whether the reference put finished above breakeven. Names scanned in the same month ride the same market, so every 95% interval is sized on an effective sample, not the row count. It is a calibration instrument for the model. It is not a performance record, and no journal result appears on this page.

Access control

Passwords are stored only as bcrypt hashes. Six failed logins in fifteen minutes lock an account for fifteen minutes, and the lock survives a restart. Existing and non-existent usernames are handled identically, so the login page reveals nothing about who has an account. No database table is reachable with the public key, and the verification suite audits every setup script and scans the repository for committed credentials on every build.

Source health, as capturedone session · 2026-10-06
01Schwab · quoteserved
02Schwab · historyserved
03Schwab · option chainserved
04Schwab · last earningsserved
05Alpha Vantage · quotenot needed
06Alpha Vantage · historyfell through
07Alpha Vantage · earningsserved
08Google Finance · quotenot needed
09Polygon · quotenot needed
10Polygon · historyserved
11yfinance · historynot needed
12FRED · risk-free rateserved
Schwab served the session's quote, price-history, option-chain and last-earnings requests; Alpha Vantage supplied the upcoming-earnings calendar and FRED the three-month Treasury rate. Amber on rung 06 is an Alpha Vantage history request that did not return usable data, so the waterfall moved down and a later rung served it. The panel reports the outcome of each request — served, fell through, or never needed — not whether a key is configured; a throttled reply that arrives looking like a success is caught rather than trusted.
Live Output  ·  captured 2026-10-06

Unedited captures from the running terminal.

These are screenshots of the deployed application, not illustrations of it — cropped to the working area, otherwise unedited; where a plate covers two screens of the same session, the two are stacked with a gap between them. One TSLA session, one scan, the same day. The charts drawn on this page are generated from that session's inputs, so every number here agrees with the screenshots beside it.
One scan session, sorted by VRPMag 7 + BTC · 8 names · 2026-10-06
TSLA+13.2 pts VRP · +2.5× noiseIV 47.6% · RV 34.4%GOOGL+7.7 pts VRP · +1.7× noiseIV 37.0% · RV 29.3%MSFT+6.3 pts VRP · +1.6× noiseIV 32.6% · RV 26.3%AMZN+3.2 pts VRP · +0.8× noiseIV 28.4% · RV 25.2%META+1.8 pts VRP · +0.3× noiseIV 43.9% · RV 42.1%AAPL+0.3 pts VRP · +0.1× noiseIV 22.5% · RV 22.2%NVDA+0.0 pts VRP · +0.0× noiseIV 28.7% · RV 28.7%BTC-USDn/a · no listed option chain, no VRP readingRV 37.1%
Scanner VRP is the name's own at-the-money implied volatility, solved by the engine from its option chain, minus 21-session Yang-Zhang realised volatility, in volatility points. Where an earnings report falls inside the thirty-day expiry the implied leg is read from the last expiry before the report, so the report's jump is not counted as premium — six of these eight were read that way. Teal bars sit outside the noise band, one standard error of the 21-day realised estimate; grey bars sit inside it, where the reading cannot be told apart from zero. Three of seven readings clear it here, and the four that do not are given no structure. BTC-USD has no listed option chain, so it carries no VRP reading; its realised leg is annualised on a 365-day calendar, the equities' on 252.
Plate 01Institutional Market Scanner
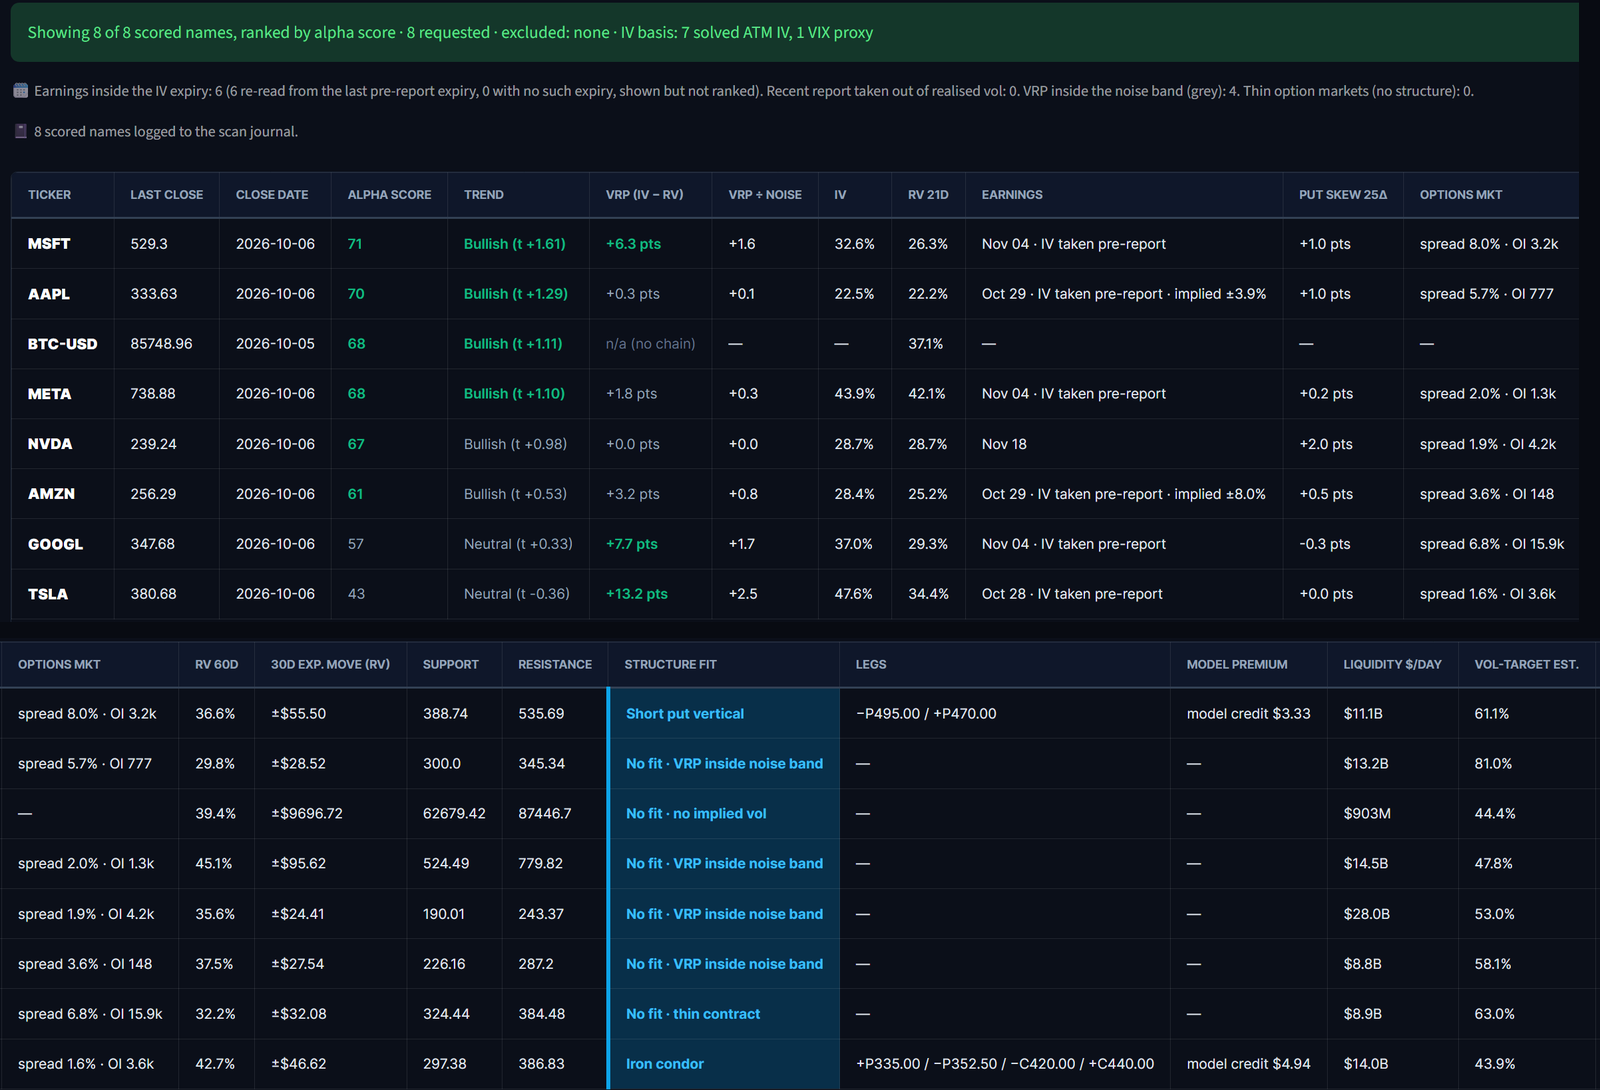
Market scanner on the Mag 7 plus Bitcoin universe. The header states 8 of 8 scored names shown, ranked by alpha score, none excluded, IV basis 7 solved at-the-money and 1 VIX proxy. Eight rows — MSFT, AAPL, BTC-USD, META, NVDA, AMZN, GOOGL, TSLA — with last close and date, alpha score, trend with its t-statistic, VRP and VRP over noise, implied and 21-day realised volatility, next earnings, 25-delta put skew and options market. A second strip shows the same rows scrolled right: 60-day realised volatility, 30-day expected move, support, resistance, structure fit, legs, model premium, underlying liquidity and volatility-target estimate. MSFT reads short put vertical, TSLA iron condor, six names no fit with the reason stated.
Screen a sector, the APEX-100 or your own watchlist, and choose what the table is ranked by — alpha score, raw VRP, or VRP in units of its own noise band. The header says how many names were requested, scored and excluded, and which implied-volatility basis each used. Each row gives the last close with its date, the trend with its t-statistic, VRP and its significance, implied and realised volatility, the next earnings report and whether the implied leg was taken before it, put skew and the quality of the options market. The second strip is the same eight rows scrolled right — the Options Mkt column appears in both, so each row can be matched — with a thirty-day expected move, support and resistance, and one structure fitted from direction and premium richness, described rather than instructed, with its legs and a model premium. Where nothing fits, the cell says why: six of eight here. The rightmost sizing column is cropped off.
Expected move cone, TSLA 31 DTEσ 43.0% · drift-corrected lognormal
+2σ 486.10+1σ 428.88−1σ 333.84−2σ 294.53spot 380.00today15d31dbands widen with √t, not linearly with t
Drift-corrected lognormal quantiles, not the uncorrected S·exp(±σ√T) shortcut. The asymmetry between the upper and lower band is the Ito term doing its work: in log space the bands are symmetric, in price space they are not.
Plate 02Deep Dive controls
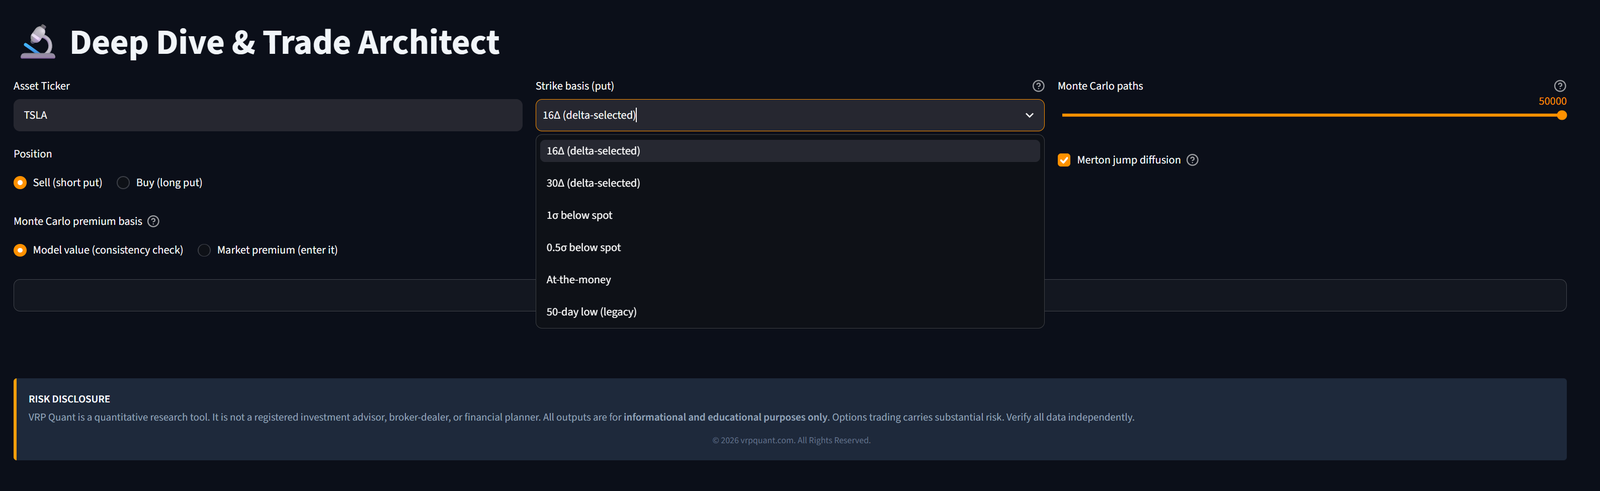
Deep Dive controls for TSLA: strike basis menu open on sixteen-delta and thirty-delta solved strikes, one-sigma and half-sigma below spot, at-the-money and the fifty-day low; position set to sell the put; Monte Carlo premium basis set to model value; Monte Carlo paths at 50,000 with Merton jump diffusion on; the risk disclosure beneath.
Six strike bases, and the distinction between them is real: on a name running forty-three percent volatility, the one-sigma band sits closer to a thirteen-delta strike than a sixteen. You set the side and size of the position and the premium the simulation is measured against — the model's own value as a consistency check, or a price you enter from your broker. Whatever you choose propagates into every Greek, tree price and simulation below.
Plate 03Deep Dive — one expiry, signed Greeks
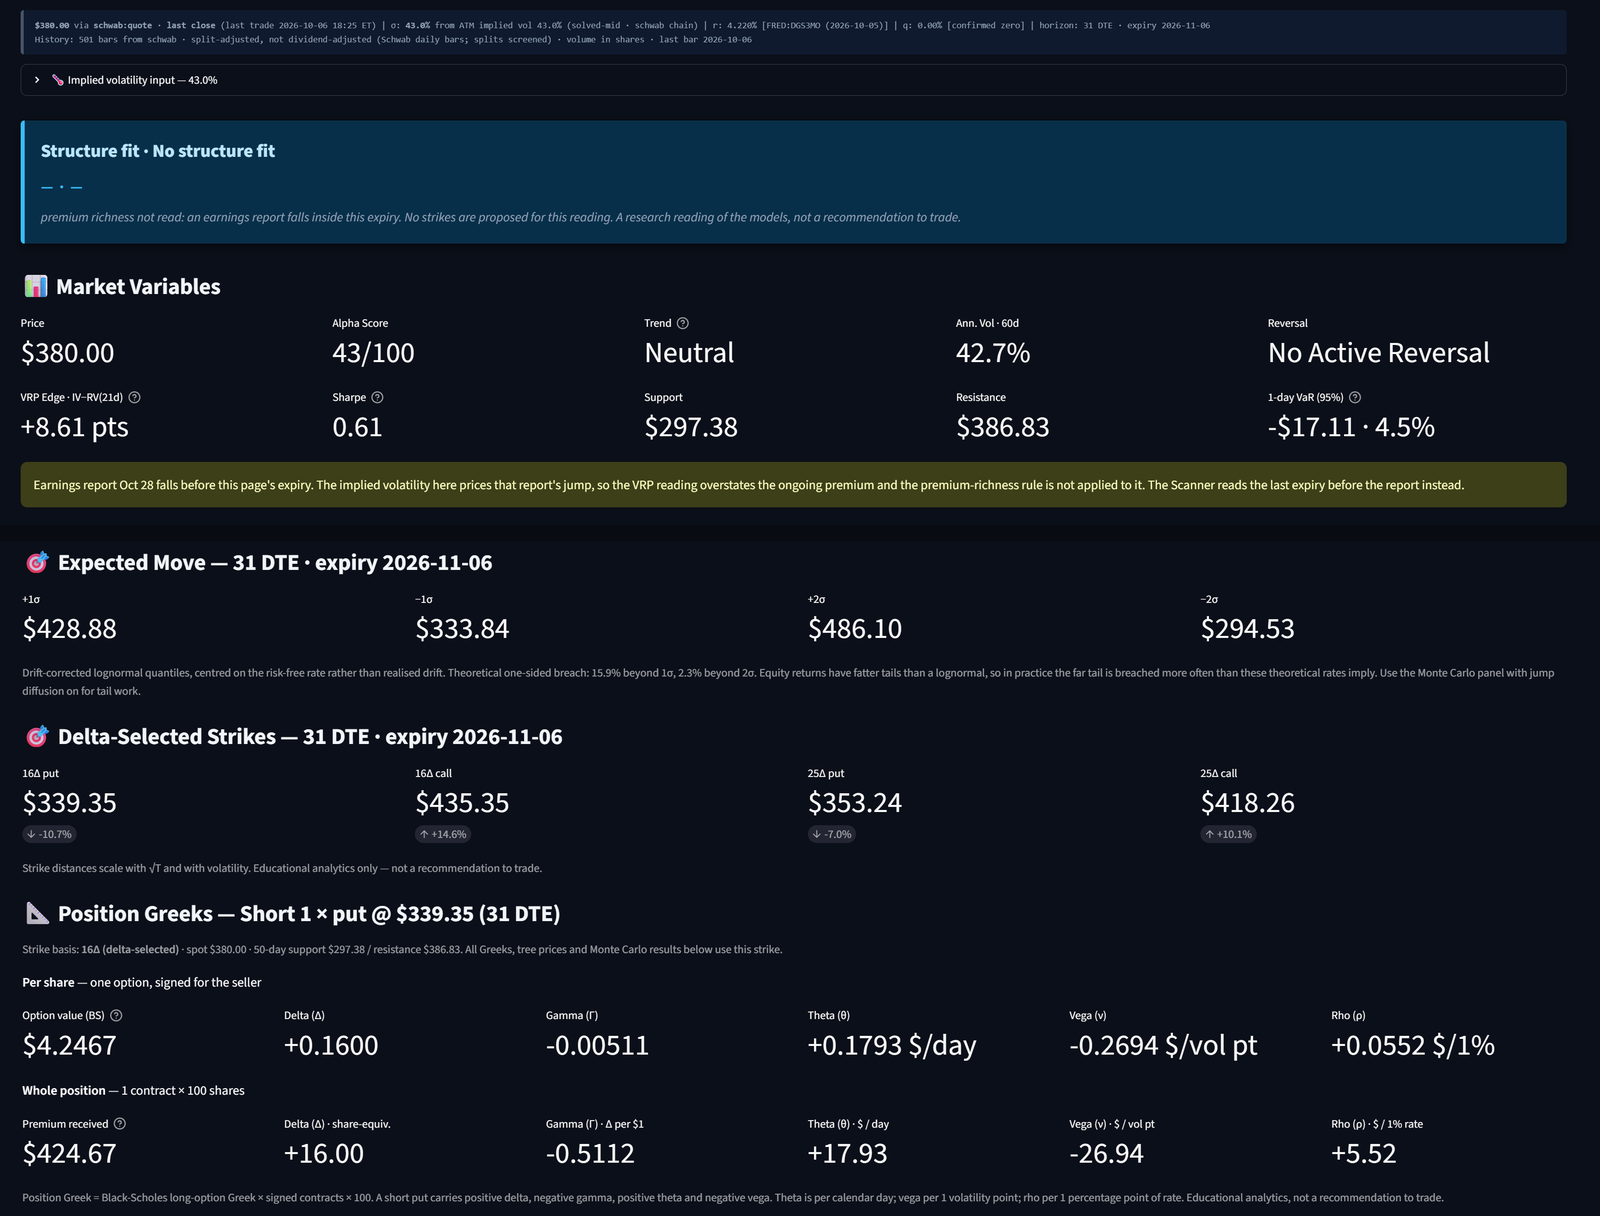
Deep Dive for TSLA. Provenance line: 380.00 from the Schwab quote, sigma 43.0 percent solved from the at-the-money options on the Schwab chain, risk-free rate 4.220 percent from FRED three-month Treasury, dividend yield confirmed zero, horizon 31 DTE, expiry 2026-11-06. Structure fit card: no structure fit, because an earnings report falls inside this expiry. Market variables: price 380.00, alpha score 43, trend neutral, 60-day volatility 42.7 percent, VRP edge +8.61 points, support 297.38, resistance 386.83, one-day VaR 17.11. A banner states the Oct 28 report falls before expiry, so the VRP reading overstates the ongoing premium. Below: expected move and delta-selected strikes both headed 31 DTE, expiry 2026-11-06; position Greeks for one short 16-delta put at 339.35 — per share delta +0.16, gamma −0.00511, theta +0.1793 dollars a day, vega −0.2694 per volatility point; for the position, premium received 424.67 and delta +16 share-equivalents. Pricing convergence for the same put: CRR European 4.2467, CRR American 4.2605, early-exercise premium 0.0138, 800-step lattice within 0.022 percent of Black-Scholes.
The provenance line states every input and its source: the price and the time of its last trade, a volatility solved from the at-the-money options on the live chain, the three-month Treasury rate, a dividend yield confirmed rather than assumed, and the contract — 31 DTE, expiry 2026-11-06. Every heading below names that same contract. TSLA reports on Oct 28, inside that expiry, and the page says so: the structure card proposes no strikes, and the banner explains that this implied volatility prices the report's jump, so its VRP overstates the ongoing premium. The Greeks are signed for the position held — a short put shows positive delta, negative gamma, positive theta and negative vega — per share and for the whole position, with the premium received shown apart from the option's model value. Beneath, the same put on an 800-step lattice: the European tree lands within 0.022% of the closed form, and the American price adds a $0.0138 early-exercise premium.
Plate 04Expected-move cone and position Greeks, charted
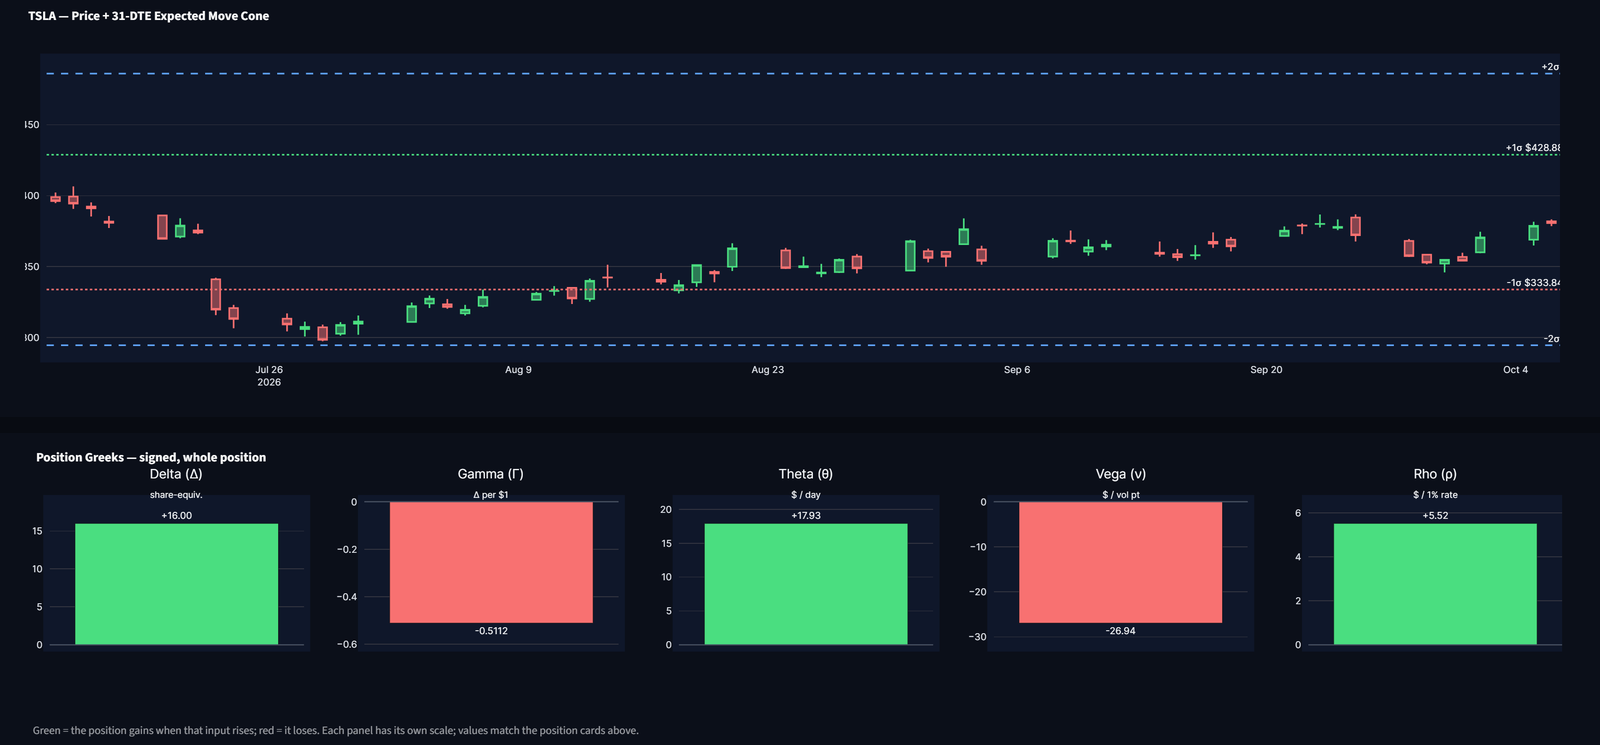
Chart of TSLA daily candles with the 31-DTE expected-move bands at plus and minus one and two sigma, the one-sigma lines labelled 428.88 and 333.84; below, five signed bar panels for the short put position: delta +16.00, gamma −0.5112, theta +17.93, vega −26.94, rho +5.52.
The bands on the price chart are the expected-move figures in Plate 03, drawn at the same expiry. Each Greek gets its own panel and its own scale, so a small number is not flattened by a large one; green means the position gains when that input rises, red that it loses. The bars carry exactly the values on the position cards.
Plate 05Kalman trend, GARCH bands and the simulation fan
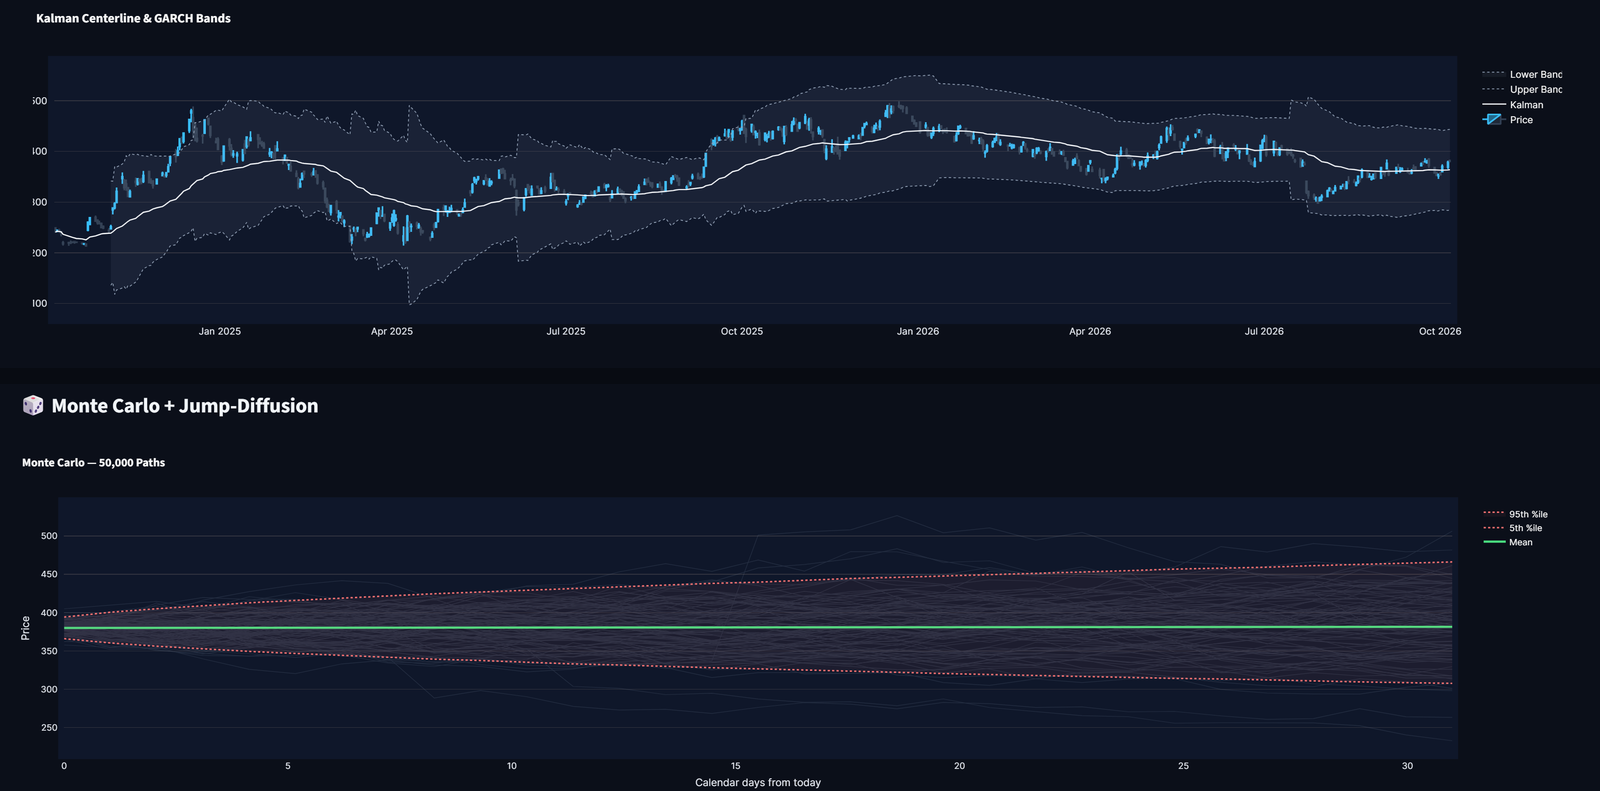
Two years of TSLA prices with a Kalman-filtered centreline and GARCH volatility bands; below, a Monte Carlo fan of 50,000 jump-diffusion paths over 31 calendar days with the mean path and the 5th and 95th percentile envelopes.
Above: the Kalman centreline and causal GARCH bands behind the terminal's underlying-signal study — every band value uses only data available before the day it describes. The terminal also reports that study's hypothetical results inside the product, labelled as such; they are deliberately not reproduced on this page. Below: sample paths from the simulation, plotted against calendar days to expiry.
Plate 06Terminal distribution at expiry
Histogram of simulated TSLA prices at expiry with the 339.35 strike and the 380.00 spot marked; the left tail under jump diffusion is visibly heavier than the right shoulder.
Where the simulated paths finish, with the strike and spot marked. The terminal computes its probabilities and expected P&L from a separate sample of one million exact expiry draws, each figure shown with its simulation error; in this session the model-value check read zero within that error, as it should.
Monte Carlo terminal distribution1,000,000 draws · 31 DTE · σ 43.0% · jump diffusion
short strike 339.3519.4% of drawsfinish below the strike80.6%expire above it200280360440520terminal price · 1,000,000 exact expiry draws
The shaded fraction is the modelled probability of finishing in the money — 19.4% here, from 1,000,000 exact expiry draws with Merton jump diffusion switched on, as the terminal runs it (±0.1 point). That is not the same number as the strike's delta of 0.16, and software that presents them as interchangeable is wrong by several points. Both are shown in the terminal, separately.
Put value
$4.2467
Delta
+0.1600
Gamma
-0.00511
Theta / day
+$0.1793
Vega / pt
-$0.2694
Rho / 1%
+$0.0552
Premium ×1
$424.67
CRR European
$4.2467
CRR American
$4.2605
Early-ex prem.
$0.0138
Where the risk actually sitsput delta and gamma across strikes
short strikeput delta, 0 to −1gamma280320360400440strike · spot 380.00 · 31 DTE · one long put
Gamma peaks near the money and collapses toward the wings, which is why a short strike far from spot is cheap to hold until it isn't. The dashed line is the 16Δ strike: low delta, and low gamma — until price migrates toward it.
Delta-selected strikes, TSLA at 31 DTEspot 380.00 · σ 43.0% · 2026-10-06
spot 380.00339.3516Δ put-10.7%353.2425Δ put-7.0%418.2625Δ call+10.1%435.3516Δ call+14.6%
Each strike is solved numerically for its delta rather than read off a chart level. The put and call wings are not the same distance from spot, and the reason is the lognormal distribution, not the market: with a single volatility across all strikes, prices can rise without limit but cannot fall below zero, so an equal-probability move is larger in dollars on the upside. This model uses one volatility for every strike and carries no skew at all — which is also why these strikes will sit inside where a skewed options market prices the same deltas on the put side.
Cushion scales with the square root of time16Δ put · σ 43.0%
14 DTE-7.56%21 DTE-9.05%31 DTE-10.70%45 DTE-12.50%62 DTE-14.22%
At a fixed delta, strike distance from spot grows roughly with √T. Doubling the tenor from 31 to 62 days buys about a third more distance, not twice as much. The terminal computes this rather than approximating it.
Verification

Proof that runs on every commit, published in full.

No market data, no API keys, no network. Each check is a closed-form identity or a convergence property — true or false independently of any market view. The suite exits non-zero on failure, so a passing run cannot be a silent one.

Property testedResult
Put-call parity across dividend yields, price and deltaHolds
Dividend yield applied exactly onceExact
CRR European convergence to Black-Scholes640/640 cases
American ≥ European, early exercise non-negative60/60 pairs
American price against a 4,000-step reference0.135% worst
One-sigma bands vs true lognormal quantileExact
One-sigma breach probability vs theory15.87 / 15.86
Volatility estimator independent of input lengthStable
Greeks sign and rangeHolds
Monte Carlo memory bounded at maximum paths< 500 MB @ 50k
No look-ahead in the walk-forward backtestPrefix-stable
GARCH forecasts unchanged when future data changesZero drift
Position Greeks signed by side and sizeHolds
Feature limits enforced at executionHolds
Monte Carlo agrees with the matching model priceWithin 4 SE
One dividend input through every pricerHolds
Quote freshness and volume unitsHolds
Every screen runs end to end before deploySmoke test
Incomplete price bars removed before any modelHolds
POP computed from the seller's P&L, net of premiumHolds
Implied volatility round-trips to the pricing volatility1.9e-05 worst
Implied volatility solver declines what it cannot identifyHolds
Realised volatility matches the textbook Yang-Zhang estimatorHolds
Market-data adapter: IV solved, never copied; one price snapshotHolds
No account or order endpoint reachable from the codeHolds
Journal intervals sized on the effective sample, not the row count19 of 400 correlated
Journal reference put carries the dividend yieldExact
Journal forward volatility uses the entry estimator (Yang-Zhang)Holds
Database closed to the public key; login lock survives a restartHolds
No credential committed to the repositoryHolds
Test calendars valid on every weekday7 / 7
Lattice convergence to closed formEuropean put · S=K=100 · 30 DTE · σ=30% · q=2%
0.10% tolerance5010020040080016000.512%shipped: averaged 800/801 tree — 0.0001%error vs Black-Scholeslattice steps (log scale)
A single lattice oscillates around the true price depending on where the strike falls between terminal nodes. Averaging adjacent depths cancels it. The shipped default is a nominal 800 steps, which holds 640 of 640 European test cases inside 0.1% of the closed-form price and puts the American price within 0.135% of a 4,000-step reference.

These establish that the arithmetic is correct. They say nothing about whether any given trade is profitable, and are not offered as though they did.

Research Use

Research and education purposes only.

VRP Quant is a quantitative research and education tool for studying the variance risk premium and how short-premium options structures are priced. There are no plans, prices or subscriptions on this site. Nothing the terminal produces is a recommendation to buy or sell any security, and nothing on this page describes a trading result.

Contact

Ask how it works.

Questions about methodology or data sources: VRP Quant's social channels — X (@VRPQuant), LinkedIn and Facebook (VRP Quant).

VRP Quant does not answer questions about whether to place a specific trade, on any channel. It is a research tool, not an advisor, and it is not registered to give individual investment advice.

Before You Ask

Straight answers, including the ones that don't sell harder.

Does the verification report mean the signals make money?

No, and it is not offered as though it does. It proves the pricing mathematics is correct. Pricing an option right is a necessary condition for the tool to be worth anything and not a sufficient one. Anyone conflating the two is selling you something.

Is there a backtest with a return figure?

The terminal runs a walk-forward, out-of-sample backtest of its underlying band signal — it trades the stock, not an options position — and shows it inside the product with a hypothetical-performance disclaimer attached. Those numbers are not reproduced on this page, because a simulated result presented as marketing is a performance claim and this is a research tool, not a track record.

Where does the data come from?

Six sources in a defined waterfall. Free-tier limits are real and the terminal tells you when it hits one rather than silently substituting stale data. The sidebar reports which source served each request, and every price on the analysis page says how fresh it is.

Can I verify the report myself?

You can check that it applies to the software you are using. The report is generated by the test suite and run by GitHub Actions against the commit named in its header, and it prints the engine file's SHA-256 fingerprint and the exact package versions it ran against. The terminal sidebar shows the same version, fingerprint and commit. Where they agree, the software in front of you is the software that was proven. The terminal's source repository is private, so the suite itself cannot be re-run from outside; the report is published in full so the result can be read rather than taken on trust.

What is the Scan Journal, and where are its results?

It logs each scanned name with a standard reference position and later checks the model against what followed: did implied volatility exceed realised, and did the reference put finish above breakeven. Its results stay inside the terminal, stated with their effective sample size and interval. They are measurements of the model, not trading results, and are deliberately not reproduced here.

Does it place trades?

No. There is no order routing and no execution of any kind — the code cannot reach an account or order endpoint, and the verification suite checks that on every build. It is a research terminal. You take your own decisions to your own broker.